Use the following graph of the bicycle market to answer the question below.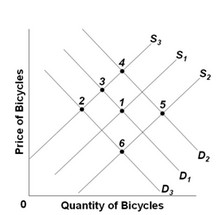 S1 and D1 are the original supply and demand curves. D2 and D3 and S2 and S3 are possible new demand and supply curves. Starting from the initial equilibrium (point 1), which point on the graph is most likely to be the new equilibrium after an increase in wages of bicycle workers and a significant increase in the price of gasoline?
A. 4
B. 3
C. 5
D. 6
Answer: A
Economics
You might also like to view...
Refer to Table 9-17. Looking at the table above, real average hourly earnings between 2015 and 2016 changed by
A) 1.2%. B) 4.5%. C) 9.9%. D) 14.5%.
Economics
The aggregate expenditure model focuses on the ________ relationship between real spending and ________
A) long-run; real GDP B) short-run; inflation C) long-run; inflation D) short-run; real GDP
Economics
The short run is a period of time during which all costs are fixed costs.
Answer the following statement true (T) or false (F)
Economics
What happens as the result of a shortage?
A) There is downward pressure on prices. B) There is upward pressure on prices. C) Consumers begin to view the good as an inferior good because they have a hard time finding it. D) Supply of the good decreases.
Economics