Demand Curve
What will be an ideal response?
A graph that shows the relationship between the price of a good and the quantity demanded.
You might also like to view...
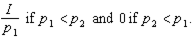
Suppose your tastes can be represented by the utility function 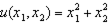 . Your demand for
  is
is
A.
 .
.B.
 .
.C.

D.
E.
Sellers are sure the demand for their product is relatively inelastic at the price currently being charged
A) could increase their net revenue by raising the price. B) could increase their total revenue by lowering the price. C) would decrease their net revenue if they raised the price. D) would decrease their total revenue if they raised the price.
Hyperinflation is defined as
A) an increase in the price level. B) rising but low inflation rates. C) very low inflation rates. D) very high inflation rates. E) declining inflation rates.
The main policy tool for manipulating consumer spending is
A. personal income tax. B. corporate income tax. C. capital gains tax. D. None of the above is correct.