Use the graph to solve the problem.The graph depicts a relationship between scores achieved on an unspecified standardized test and family income. Find the rate of change of test scores with respect to family income.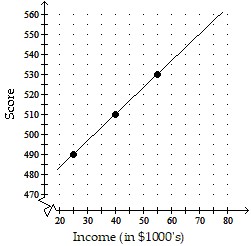
A. 4 points per thousand dollars
B.  points per thousand dollars
C. 20 points per thousand dollars
D.  points per thousand dollars
Answer: B
Mathematics
You might also like to view...
Convert the number to the indicated base.7815nine to base three
A. 21221012three B. 1001251112three C. 21121002three D. 11211011three
Mathematics
The two figures are congruent. Find the measure of the requested side or angle.

A.  = 21
= 21
B.  = 6
= 6
C.  = 15
= 15
D.  = 12
= 12
Mathematics
Perform the indicated operation(s). Where possible, reduce the answer to lowest terms.

A. - 
B. - 
C. 
D. 
Mathematics
Identify the vertex and axis of symmetry for the parabola.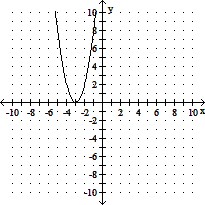
A. (0, -3); x = -3 B. (-3, 0); y = 0 C. (-3, 0); x = 0 D. (-3, 0); x = -3
Mathematics