The graph below shows the approximate annual percentage growth rate in world population for the years 1960 through 2010. Data is estimated by the UN Census Bureau.Annual Growth Rate (Percentage) 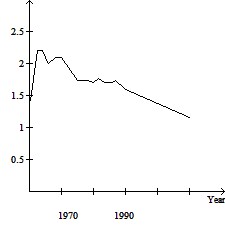 Use the graph to answer the question.Describe the trend in world population during the period 1990-2000
A. It decreases at a steady rate
B. It decreases at a faster and faster rate
C. It increases at a steady rate
D. It increases at a slower and slower rate
Answer: D
Mathematics
You might also like to view...
Perform the indicated operation and, if possible, simplify. Assume that all variables represent positive real numbers. 9 + 9
+ 9
A. 18
B. 9
C. -27
D. 27
Mathematics
Evaluate the indicated function with the given information.Find sin 2x if cos x =  (in fourth quadrant).
A. - 
B. 
C. - 
D. 
Mathematics
Answer the question.How does one decide whether a set of points is included in the domain of a function? In the range?
What will be an ideal response?
Mathematics
Simplify the expression. ?
? 
A. 3
B. 
C. 3
D. 9
Mathematics