The following double-bar graph illustrates the revenue for a company for the four quarters of the year for two different years. Use the graph to answer the question.  How much more revenue did the company take in for the fourth quarter of 2010 than the second quarter of 2009?
A. $7 million
B. $35 million
C. $6 million
D. $30 million
Answer: B
Mathematics
You might also like to view...
Find the focus and directrix of the parabola.-  x2 = y
A. (0, -10); y = -10 B. (-20, 0); x = 10 C. (0, 10); y = -10 D. (0, -10); y = 10
Mathematics
Find the first four terms of the binomial series for the given function.(1 + 5x)1/2
A. 1 +  x -
x -  x2 +
x2 +  x3
x3
B. 1 -  x +
x +  x2 -
x2 -  x3
x3
C. 1 +  x -
x -  x2 +
x2 +  x3
x3
D. 1 -  x +
x +  x2 -
x2 -  x3
x3
Mathematics
Find the second derivative of the function.r =  (3 - ?)
A.  =
= 
B.  = -
= -  - 1
- 1
C.  = -
= -  - 1
- 1
D.  =
=  - ?
- ?
Mathematics
Sketch the graph and show all local extrema and inflection points.y = x
A. Local minimum:  ; local maximum:
Inflection point: (0, 0)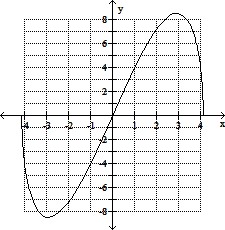
B. Local minimum:  ; local maximum:
Inflection point: (0, 0)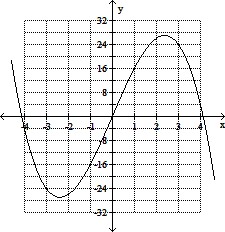
C. Local maximum at 
No inflection points.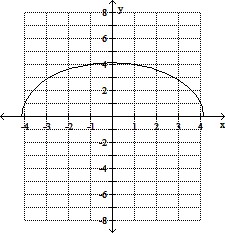
D. Local maximum: 
No inflection point.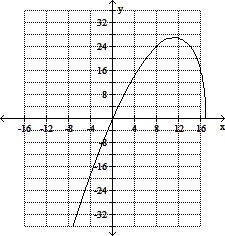
Mathematics