In the following figure, AB is the production-possibility curve of Canada. The line PQ shows the price ratio of one bushel of wheat/bale of cotton. The international price ratio is 0.25 bushels of wheat/bale of cotton as shown by the line RS. I1 and I2 are two of the community indifference curves of Canada. Which of the following can be inferred from this figure?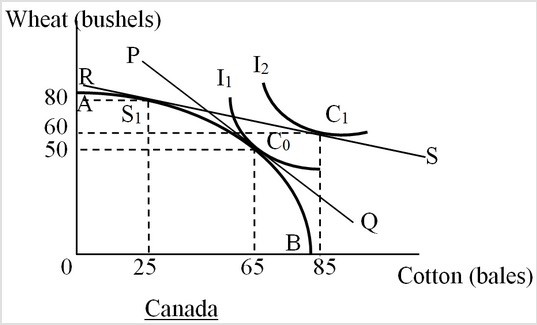
A. Canada has a comparative advantage in the production of wheat.
B. Canada has an absolute advantage in the production of both goods.
C. Canada has an absolute disadvantage in the production of both goods.
D. Canada has a comparative advantage in the production of cotton.
Answer: A
You might also like to view...
If real GDP is less than potential GDP, then the money wage rate ________, and aggregate supply ________ so that the price level ________
A) rises; decreases; rises B) does not change; increases; falls C) falls; decreases; rises D) rises; increases; falls E) falls; increases; falls
The figure above illustrates the problem of overcrowding and external costs experienced during the summer months in the state park. The competitive equilibrium is at
A) point G. B) point H. C) point I. D) point J.
The "Walker thesis," that falling birth rates among native-born Americans was due to immigration, is reinforced by the view that immigrants were a direct capital transfer from Europe to America
Indicate whether the statement is true or false
Economists sometimes refer to the resource category land as natural resources
Indicate whether the statement is true or false