Draw a scatter plot of the data given in the table.The total in billions of dollars of Canadian farm trade surplus to a particular country from 1996 to 1999 is given in the following table.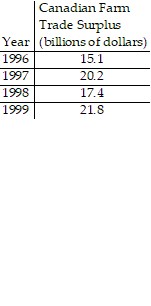 ?
?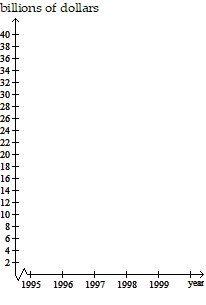
A. billions of dollars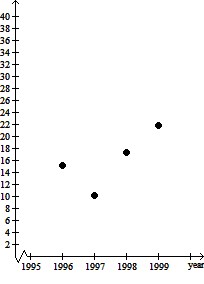
B. billions of dollars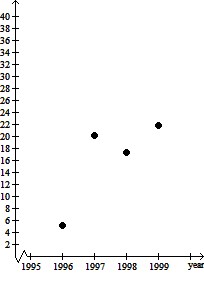
C. billions of dollars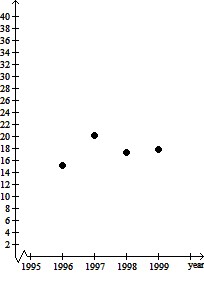
D. billions of dollars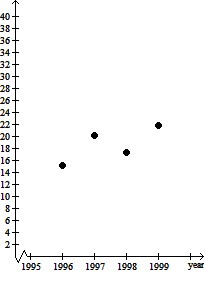
Answer: D
Mathematics
You might also like to view...
Express the area of the region bounded by the given line(s) and/or curve(s) as an iterated double integral.The lines  ,
,  , and
, and 
A. 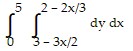
B. 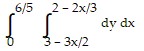
C. 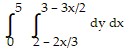
D. 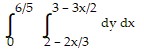
Mathematics
When a function reaches a maximum value (at a peak), the rate of change is 0.
Answer the following statement true (T) or false (F)
Mathematics
Find the probability of the event.A 6-sided die is rolled. What is the probability of rolling a number less than 6?
A. 
B. 
C. 
D. 
Mathematics
Evaluate the given function.f(x) = -4x2 - 3x - 18, f(-2)
A. 8 B. -28 C. -4 D. -40
Mathematics