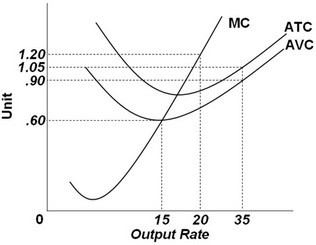
 Refer to the above graph. It shows the cost curves for a competitive firm. At output level 20, the marginal cost is:
A. $0.90.
B. $1.05.
C. $1.20.
D. $0.60.
Answer: C
You might also like to view...
Use to following graph. 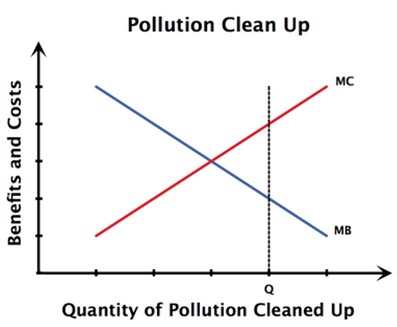 Suppose Asarta Inc. is polluting yucko and they have been tasked with cleaning up some of their waste. If they are cleaning up Q tons of yucko then they are cleaning:
A. too little. B. too much. C. just the right amount. D. the allocatively efficient amount.
The high correlation between rapid growth in exports and rapid economic growth observed in several East Asia countries in recent decades
A) proves that export promoting trade policy leads to relatively rapid economic growth. B) proves that a free-trade orientation of trade policy results in rapid economic growth. C) proves that exports help growth, whereas imports impede growth. D) proves that trade policy is the most important policy area for promotion of economic development. E) does not prove that trade liberalization always leads to rapid economic growth.
Which piece of legislation allowed states to pass right-to-work laws?
A) Wagner Act B) Landrum-Griffin Act C) Taft-Hartley Act D) National Industrial Recovery Act
Refer to the graphs shown. In which graph is there no producer surplus either with or without a per-unit tax?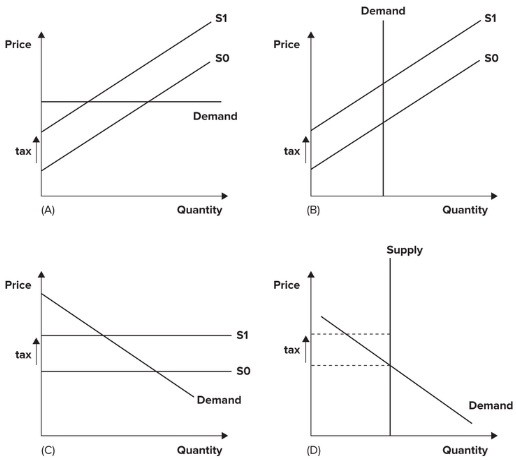
A. B. B. A. C. C. D. D.