Solve the problem.The following graph shows the private, public and total national school enrollment for students for select years from 1970 through 2000.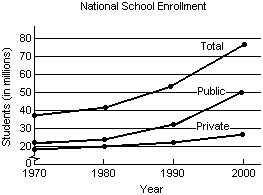 i) How is the graph for total school enrollment, T, determined from the graph of the private enrollment, r, and the public enrollment, u?ii) During which 10-year period did the total number of students enrolled increase the least?iii) During which 10-year period did the total number of students enrolled increase the most?
A.
| i) | T is the sum of r and u. |
iii) 1990-2000
B.
| i) | T is the sum of r and u. |
iii) 1970-1980
C.
| i) | T is the difference of r and u. |
iii) 1990-2000
D.
| i) | T is the sum of r and u. |
iii) 1980-1990
Answer: A
Mathematics
You might also like to view...
Evaluate the exponential expression.107
A. 1,000,000 B. 100,000,000 C. 70 D. 10,000,000
Mathematics
Solve the problem.How many ways are there to choose the answers to a test that consists of ten true-false questions followed by eight multiple-choice questions with four possible answers each?
A. 66,560 B. 4196 C. 409,600 D. 67,108,864
Mathematics
Solve the problem.A bacterial culture has an initial population of 10,000. If its population declines to 5000 in 4 hours, what will it be at the end of 6 hours?
A. 1768 B. 5743 C. 2500 D. 3536
Mathematics
Evaluate. Assume u > 0 when ln u appears. 
A.  x8(x8 + 6)3/2 + C
B.  + C
+ C
C.  (x8 + 6)3/2 + C
D.  (x8 + 6)3/2 + C
Mathematics