This graph shows three different budget constraints: A, B, and C.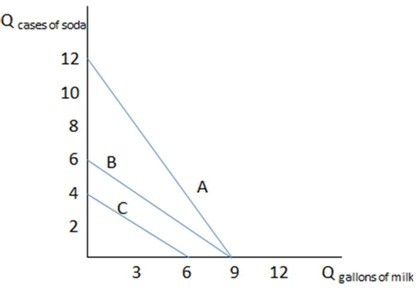 If we compare budget constraint A to budget constraint B in the graph shown, what can be said of the relative prices reflected in the two?
A. Because B is steeper, soda is relatively less expensive in A than in budget constraint B.
B. Because B is flatter, soda is relatively more expensive in A than in budget constraint B.
C. Because A is flatter, soda is relatively more expensive in A than in budget constraint B.
D. Because A is steeper, soda is relatively less expensive in A than in budget constraint B.
Answer: D
You might also like to view...
An economic variable that is measured per unit of time, such as spending per year, is known as a: a. stock variable
b. periodic variable. c. dummy variable. d. flow variable. e. controlled variable.
As the service sector in the U.S. economy grows, traditional productivity measures will become:
a. biased downward, because the qualitative aspects of a service tend to be understated. b. biased upward, because quantitative improvements in the service sector tend to be overstated. c. biased upward, because prices in the service sector always rise faster than prices in manufacturing. d. biased downward, because service output leads to a long-run decline in the inflation rate. e. completely inappropriate for measuring even manufacturing output.
A decrease in the price level
A) shifts the SRAS curve to the right. B) shifts the SRAS curve to the left. C) causes an upward movement along the existing SRAS curve. D) causes a downward movement along the existing SRAS curve. E) none of the above
Which of the following contributes to stagflation?
A. Job training programs that train workers to perform economically useful jobs. B. Lowering marginal tax rates. C. Price ceilings. D. Discrimination that prevents the most productive employee from being hired.