The following double-bar graph illustrates the revenue for a company for the four quarters of the year for two different years. Use the graph to answer the question. 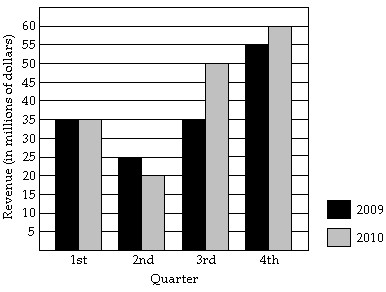 In what quarter was the revenue the greatest for 2009?
A. first quarter
B. second quarter
C. fourth quarter
D. third quarter
Answer: C
Mathematics
You might also like to view...
Find the distance between the pair of points.(2 , 2
, 2 ) and (9
 , -2
, -2 )
)
A. 2
B. 
C. 274
D. 220
Mathematics
Add or subtract. Assume all variables represent positive real numbers.4 + 14
+ 14
A. 18
B. 18
C. 10
D. 18
Mathematics
What is the sum of the measures of the exterior angles of a decagon?
What will be an ideal response?
Mathematics
Solve the equation. = -4
= -4
A. 1 B. 12 C. -8 D. -7
Mathematics