Solve the problem.The dropout rates of students at State University (rates per 1000 students) are shown in the table for various years. Let r be the dropout rate (number of dropouts per 1000 students) at t years since 2000.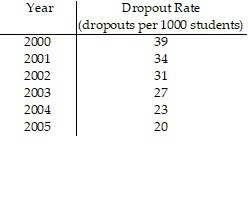
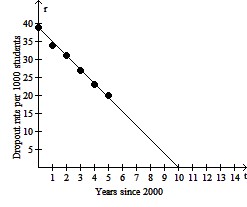 a. What is the r-intercept of the model? What does it mean in this situation?b. Use the linear model to predict when the dropout rate will be 8 per 1000 studentsc. What is the t-intercept of the model? What does it mean in this situation?d. Predict the dropout rate in 2012. Explain.
What will be an ideal response?
a. (0, 39); the dropout rate in 2000 was 39 dropouts per 1000 students
b. 2008; answers may vary
c. (10, 0); in 2010 the dropout rate will be 0
d. -9 dropouts per 1000 students; model breakdown; answers may vary
Mathematics
You might also like to view...
Add and simplify. +
+ 
A. 
B. 
C. 
D. 2
Mathematics
Use Cramer's Rule, if possible, to solve the system of linear equations. 
A. (-5, -3) B. (3, 5) C. (5, 3) D. (-3, 5)
Mathematics
Solve the inequality algebraically. Express the solution in interval notation.(x - 2)2(x + 5) < 0
A. (-?, -5) or (5, ?) B. (-5, ?) C. (-?, -5) D. (-?, -5]
Mathematics
Use a graphing utility to find the equation of the line of best fit. Round to two decimal places, if necessary.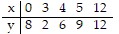
A. y = 0.63x + 4.88 B. y = 0.53x + 4.88 C. y = 0.43x + 4.98 D. y = 0.73x + 4.98
Mathematics