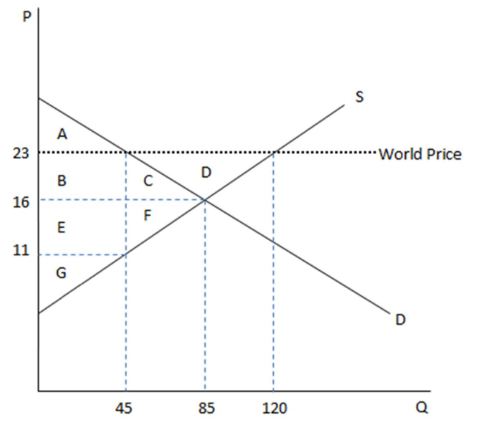
According to the graph shown, if this economy was to engage in free trade, the good would:
This graph demonstrates the domestic demand and supply for a good, as well as the world price for that good.
A. be imported.
B. be exported.
C. no longer be produced domestically.
D. not be imported or exported and only be produced domestically.
B. be exported.
You might also like to view...
In the above figure, curve D slopes downward because
A) average fixed costs decrease as output increases. B) all costs decrease as output increases. C) there are diminishing returns. D) there are decreasing marginal costs.
If market price is greater than the minimum of AVC but below the minimum of AC, then
A) the firm will shut down. B) revenue covers variable costs and some of the fixed costs and profit is positive. C) revenue covers variable costs and some of the fixed costs, although profit is negative. D) economic profit is zero.
Labor (# of employees)Total Output0011025031104160520062307255827592901030011305Assume the table shown is for a hat factory, and shows the total production of hats given various numbers of employees. Adding a seventh employee adds:
A. 275 hats to total production. B. 20 hats to total production. C. 255 hats to total production. D. 25 hats to total production.
Use the following consumption schedule to answer the next question. 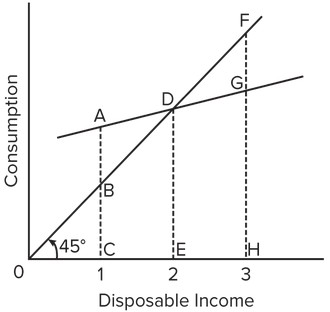 At income level 3, the amount of saving is represented by the line segment
A. FD. B. GH. C. FG. D. FH.