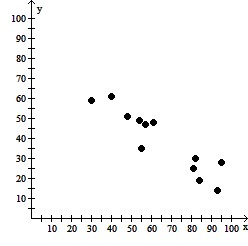
Construct the requested statistical display.The one-day temperatures for 12 world cities along with their latitudes are shown in the table below. Make a scatterplot for the data. 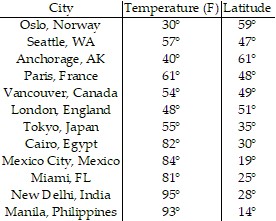

 Temperature (F)°
What will be an ideal response?
Temperature (F)°
You might also like to view...
Provide an appropriate response.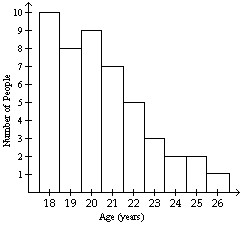 What is the modal class?
A. 18 years B. 22 years C. 26 years D. 23 and 24 years
Determine where the function is increasing and where it is decreasing.f(x) = x2 + 8x + 7
A. increasing on (-4, ?) decreasing on (-?, -4) B. increasing on (-?, -9) decreasing on (-9, ?) C. increasing on (-9, ?) decreasing on (-?, -9) D. increasing on (-?, -4) decreasing on (-4, ?)
Provide an appropriate response.In a raffle 1000 tickets are being sold at $1.00 each. The first prize is $100, and there are 3 second prizes fo $50 each. By how much does the price of a ticket exceed its expected value?
A. $1.00 B. $0.75 C. $1.75 D. $50
Select the functions that have identical graphs.(i) y = cos x(ii) y = sin x(iii) y = sin 
A. i, ii and iii B. i and iii C. ii and iii D. i and ii