According to Table 2.1, which presents hypothetical data on price elasticity of demand, which of the following would be true if the price of all four goods were to increase by 3%?
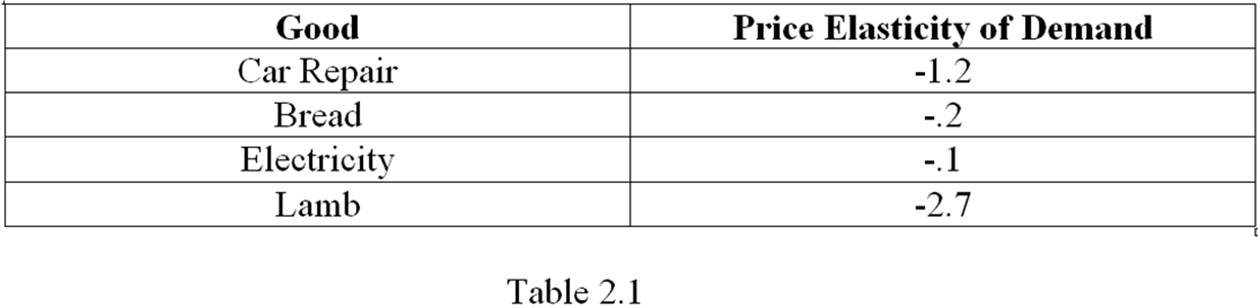
A. The quantity of car repairs demanded would decrease by a smaller percentage than would the quantity of bread demanded.
B. The quantity of car repairs demanded would increase by a smaller percentage than would the quantity of lamb demanded.
C. The quantity of electricity demanded would decrease by a smaller percentage than would the quantity of lamb demanded.
D. The quantity of electricity demanded would increase by a smaller percentage than would the quantity of bread demanded.
C. The quantity of electricity demanded would decrease by a smaller percentage than would the quantity of lamb demanded.
You might also like to view...
Regarding the relationship between marginal profit and average profit, which of the following statements is NOT true?
A. If the average profit is rising, the marginal profit figure must be rising. B. If marginal profit is lower than average profit, then average profit must decrease when profit increases. C. If marginal profit is below average profit, the average profit decreases. D. All of these statements are true.
Refer to the table below. Suppose the perfectly competitive market for dairy products had a 40 percent chance of a high price of $3.00 and a 60 percent chance of a low price of $2.00. However, both Happy Cows and Free Cows have revised their probabilities and now believe that the probability of a high price of $3.00 is 80 percent and the probability of a low price of $2.00 is 20 percent. If the
managers of Free Cows want to maximize expected profit based on the new probabilities by how much will they change the quantity produced?
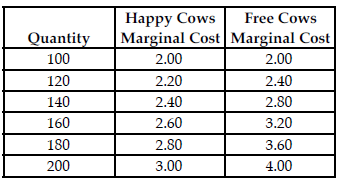
Happy Cows and Free Cows are two separate perfectly competitive dairy farms. The table above shows the respective firms' marginal cost at various production levels.
A) Free Cows will increase their production by 40 units.
B) Free Cows will decrease their production by 40 units
C) Free Cows will decrease their production by 20 units.
D) Free Cows will increase their production by 20 units.
The law of demand is graphically demonstrated by a(n):
a. perfectly vertical demand curve. b. perfectly horizontal demand curve. c. downward-sloping demand curve. d. upward-sloping demand curve. e. curved demand line.
A monopolist sells its output in two markets, each with different demand curves as shown in this figure. If the marginal cost is identical in both markets, the monopolist should charge a ______ price in the inelastic market, represented by the demand curve ______.
Fill in the blank(s) with the appropriate word(s).