The pie chart below shows the number of pizzas consumed by college students in a typical month. Use the chart to answer the question. 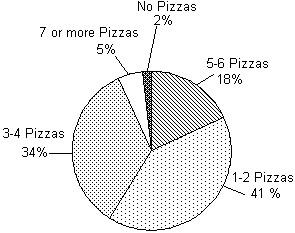 What percent of college students consume no pizzas in a typical month?
A. 5%
B. 34%
C. 2%
D. 18%
Answer: C
Mathematics
You might also like to view...
Perform the indicated operation. Write the result in scientific notation.(8 × 10⁹)(6.1 × 10⁹)
A. 4.88 × 1081 B. 488 × 1018 C. 48.8 × 10¹⁹ D. 4.88 × 10¹⁹
Mathematics
Solve the problem.To obtain a certain shade of paint, Peter mixed 5 gallons of white paint with 2 gallons of brown and 6 gallons of blue paint. How much paint did he have?
A. 13 gallons
B.  gallon
C.  gallon
D. 4 gallons
Mathematics
Evaluate the function at the indicated value.Find f(x + h) when f(x) =  .
.
A. 
B. 
C. 
D. 
Mathematics
Factor by grouping.x3 + 7x2 - 6x - 42
A. (x2 + 7)(x - 6) B. (x3 - 6x)(x + 7) C. (x2 - 6)(x - 7) D. (x2 - 6)(x + 7)
Mathematics