The United States had the largest real GDP per person until the 2012 when the China's real GDP per person overtook and then exceeded that in the United States
Indicate whether the statement is true or false
FALSE
You might also like to view...
According to the article, the best description of Canada's position in the business cycle is
A) at a peak. B) at a trough. C) in an expansion. D) in a recession.
The above figure shows the market demand curve for mobile telecommunications (time spent on a mobile phone). If the price were zero, consumer surplus equals
A) $301.00. B) $924.50. C) $1,225.50. D) $1,250.00.
Graphically, a firm's total revenue is represented by the:
a. triangle formed under the demand curve. b. rectangle formed under the demand curve at a given price and quantity combination. c. rectangle formed under the average-total-cost curve at a given ATC and quantity combination. d. triangle formed by a line segment between the demand and average-total-cost curves at any level of output. e. triangle formed by a line segment between the horizontal axis and the average-total-cost curves at any level of output.
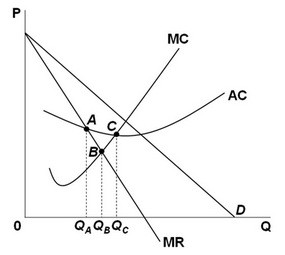 In the figure above:
A. point A, where MR = AC, represents the point where the difference between total revenue and total cost is the largest. B. triangle ABC represents the welfare loss to the society because of the monopoly in the market. C. if the firm is producing an amount QC (point C), it is maximizing profit because MC = AC at that point. D. point B, where MR = MC, represents the point where the difference between total revenue and total cost is the largest.