Provide an appropriate response.Explain how the graph of f(x) = ln x could be used to graph the function g(x) = ex - 1.
What will be an ideal response?
Reflect the graph of f(x) = ln x across the line y = x and then translate it to the right one unit.
You might also like to view...
Solve the problem.The graph of y = f(x) in the accompanying figure is made of line segments joined end to end. Graph the derivative of f.
A. 
B. 
C. 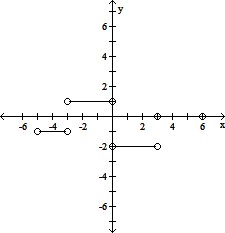
D. 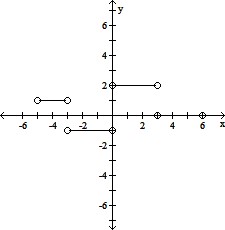
Find the average rate of change for the function between the given values.f(x) = 2x - 6; from 1 to 3
A. -2 B. -6 C. 2 D. 6
Solve the problem.The function  can be used to determine the milligrams D of a certain drug in a patient's bloodstream h hours after the drug has been given. How many milligrams (to two decimals) will be present after
A. 0.49 mg B. 5.81 mg C. 131.56 mg D. 0.29 mg
Find the least common multiple (LCM) of the pair of numbers.8 and 12
A. 96 B. 4 C. 384 D. 24