Refer to the data. If columns (1) and (3) of the demand data shown are this firm's demand schedule, economic profit will be:
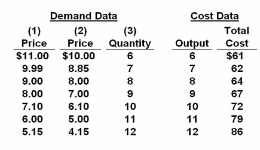
A. $10.
B. $19.
C. $6.
D. $8.
D. $8.
You might also like to view...
Refer to Figure 4-7. The figure above represents the market for iced tea. Assume that this is a competitive market. If the price of iced tea is $1, what changes in the market would result in an economically efficient output?
A) The price would increase, the quantity supplied would increase, and the quantity demanded would decrease. B) The price would increase, quantity demanded would increase, and quantity supplied would decrease. C) The quantity supplied would increase, the quantity demanded would decrease, and the equilibrium price would increase. D) The price would increase, the demand would increase, and the supply would decrease.
When the U.S. experiences economic growth, the poverty rate will:
A. fall, because growth has benefited everyone. B. increase, because growth typically only benefits the richest 1 percent. C. fall, because growth typically helps the poor more than the wealthy. D. increase, because growth has benefited the wealthy more than the poor.
If the Fed responds to an increase in government spending with the goal of stable prices and output, which of the following would be the result?
a. A larger multiplier effect than normal b. Partial crowding out c. An increase in consumption and investment spending d. No crowding out e. Complete crowding out
Producer surplus is the
a. area under the supply curve to the left of the amount sold. b. amount a seller is paid minus the cost of production. c. area between the supply and demand curves, above the equilibrium price. d. cost to sellers of participating in a market.