Solve the problem.A study was conducted to compare the average time spent in the lab each week versus course grade for computer students. The results are recorded in the table below. Use a graphing calculator to find the equation of the regression line of the following data. Let x represent hours spent in the lab.Number of hours spent in labGrade (percent) 109611511662958789158116461051
A. y = -1.86x + 88.6
B. y = 88.6x + 1.86
C. y = 44.3x + 0.930
D. y = 0.930x + 44.3
Answer: A
Mathematics
You might also like to view...
Make the required change in the given equation.? =  to Cartesian coordinates
A. z = 0
B. 2z = 
C. y = 0
D. x = 0 and y = 0
Mathematics
Find the area of the surface generated when the given curve is revolved about the x-axis. y = 4x + 5 on [0, 6]
A. 
B. 192 ?
?
C. 204 ?
?
D. 204?
Mathematics
Write the shaded area in the figure as a mixed number and as an improper fraction.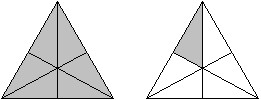
A. 1 ;
; 
B. 1 ;
; 
C. 1 ;
; 
D. 1 ;
; 
Mathematics
Solve the problem.A local bank advertises that it pays interest on savings accounts at the rate of 3% compounded monthly. Find the effective rate. Round answer to two decimal places.
A. 3.44% B. 3.40% C. 3.04% D. 36%
Mathematics