Graph the line.Through (-2, 2), undefined slope.
A. 
B. 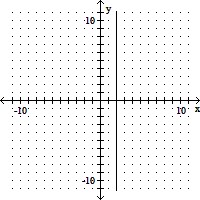
C. 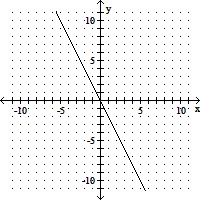
D. 
Answer: D
You might also like to view...
Solve the problem.The table below gives the number of births, in thousands, to females over the age of 35 for a particular state every two years from 1994 to 2010. 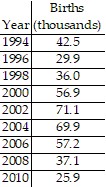 Use technology to find the quartic function that is the best fit for this data, where x is the number of years after 1994. Round to five decimal places.
A. y = - 0.01723x4 + 0.62258x3 - 6.66654x2 + 18.98367x - 43.26566 B. y = 0.01723x4 - 0.62258x3 + 6.66654x2 - 18.98367x + 43.26566 C. y = 43.26566x4 - 18.98367x3 + 6.66654x2 - 0.62258x + 0.01723 D. y = 0.02223x4 - 0.82248x3 + 8.66654x2 - 15.98367x + 41.96566
If the following is a polynomial function, then state its degree and leading coefficient. If it is not, then state this fact.f(x) = 
A. Degree: 3; leading coefficient: 4 B. Degree: 12; leading coefficient: 3 C. Degree: 4; leading coefficient: 3 D. Not a polynomial function
Find the length of the arc on the circle of radius r meters intercepted by a central angle ?. Round your answer to three decimal places.r = 5, ? = 55°
A. 3.84 m B. 4.32 m C. 4.8 m D. 5.28 m
Solve the problem.Suppose that P(x) represents the percentage of income spent on housing in year x and I(x) represents income in year x. Determine a function H that represents total housing expenditures in year x.
A. H(x) =  (x)
(x)
B. H(x) = (P + I)(x)
C. H(x) = (I - P)(x)
D. H(x) = (P ? I)(x)