Refer to the information provided in Figure 3.12 below to answer the question(s) that follow.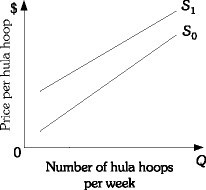 Figure 3.12Refer to Figure 3.12. The supply curve for hula hoops shifts from S1 to S0. This could be caused by
A. a decrease in the number of firms selling hula hoops.
B. a decrease in the cost of producing hula hoops.
C. a decrease in the demand for hula hoops.
D. a decrease in the price of hula hoops.
Answer: B
You might also like to view...
Which of the following will cause equilibrium output in a market to increase?
a. A decrease in firms’ variable costs. b. An outward shift of the demand curve. c. Entry of more firms into the market. d. All of the above.
A common definition of a recession is a period of time
A) of at least 6 months during which real GDP decreases. B) with an increase in real economic output from the previous period. C) with no change in real GDP. D) with no change in the dollar (money) value of economic output.
Virtually all Federal Reserve open-market purchases and sales are conducted with government securities, mostly
A) Treasury bills. B) Treasury notes. C) Treasury bonds. D) savings bonds.
Compare and contrast the short-run aggregate supply (SRAS) curve and the long-run aggregate supply (LRAS) curve. What elements do they have in common? What elements differ between them?
What will be an ideal response?