Solve the problem.Suppose that the speed of a car, measured in miles per hour (mph), is monitored for some short period of time after the driver applies the brakes. The following table and graph relate the speed of the car to the amount of time, measured in seconds (sec), elapsed from the moment that the brakes are applied.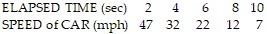
 What general trend do the data reflect? In which of the time intervals does the speed change the most?
A. With increasing elapsed time, the speed decreases. The speed changes most during the time interval from 8 seconds to 10 seconds.
B. With increasing elapsed time, the speed increases. The speed changes most during the time interval from 8 seconds to 10 seconds.
C. With increasing elapsed time, the speed increases. The speed changes most during the time interval from 2 seconds to 4 seconds.
D. With increasing elapsed time, the speed decreases. The speed changes most during the time interval from 2 seconds to 4 seconds.
Answer: D
You might also like to view...
Find all vertical asymptotes of the given function.f(x) = 
A. x = 1, x = -4 B. x = -1 C. x = -1, x = 4 D. x = -1, x = -4
Multiply.(13x + 7)(13x - 7)
A. 169x2 - 182x - 49 B. 169x2 - 49 C. 169x2 + 182x - 49 D. x2 - 49
Simplify.1 +  -
-  2 +
2 +  3
3
A. 
B. 1
C. 1
D. 1
Find the remainder when f(x) is divided by (x - k)f(x) = 3x2 - 4x - 2; k = -5
A. 93 B. 73 C. 113 D. 53