Graphical Analysis: The graph in the figure shows the position of a particle as a function of time as it travels along the x-axis.(a) What is the magnitude of the average velocity of the particle between t = 1.0 s and t = 4.0 s?(b) What is the average speed of the particle between t = 1.0 s and t = 4.0 s?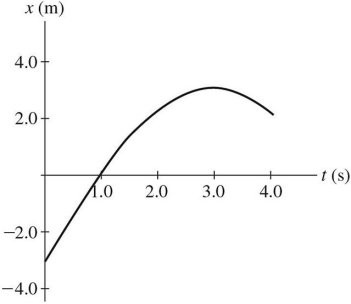
What will be an ideal response?
(a) 0.67 m/s (b) 1.3 m/s
You might also like to view...
Consider two different isotopes of the same neutral element. Which statements about these isotopes are true? (There may be more than one correct choice.)
A) Both isotopes contain the same number of orbital electrons. B) The sum of the protons and neutrons is the same for both isotopes. C) Both isotopes contain the same number of protons. D) Both isotopes contain the same number of neutrons. E) Both isotopes contain the same number of nucleons.
In an LRC circuit, if the condition R2 = L/C holds, the circuit is
A) overdamped. B) not affected. C) underdamped. D) totally inundated. E) critically damped.
A stone is thrown from the top of a building with an initial velocity of 20 m/s downward. The top of the building is 60 m above the ground. How much time elapses between the instant of release and the instant of impact with the ground?
a. 2.0 s b. 6.1 s c. 3.5 s d. 1.6 s e. 1.0 s
Almost all stars on the main sequence range from 1 to 10 solar luminosities
Indicate whether the statement is true or false