The following table shows the numbers of U.S. cellular subscriberships (in millions) from 1985 to 2002.
Year
Subscriberships
Year
Subscriberships
1985
0.340
1994
24.134
1986
0.682
1995
33.786
1987
1.231
1996
44.043
1988
2.069
1997
55.312
1989
3.509
1998
69.209
1990
5.283
1999
86.047
1991
7.557
2000
109.478
1992
11.033
2001
128.375
1993
16.009
2002
140.767
?
Source:The CTIA Semi-Annual Wireless Industry SurveyAssume that the number of U.S. cellular subscriberships, in millions, can be modeled by the function  , where t is the number of years past 1980. Use the second derivative to estimate how fast the rate of increase in subscriberships was changing in 1991 in millions of subscriberships per year.
?
A. 121.08
B. -121.08
C. 1.08
D. -1.08
E. 0
Answer: C
You might also like to view...
Solve the following circle graph problems.If total expenses are $960 and the cost of books is $48, how many degrees in a circle graph would books represent?
A. 20° B. 22.5° C. 15° D. 18°
Find the reciprocal of the expression.
A. 
B. 
C. 
D. 
Find the quotient.
A. 303.06 B. 0.30306 C. 3.0306 D. 0.030306
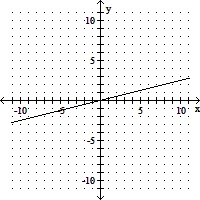
Graph the linear equation.x = 4y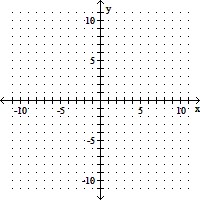
A. 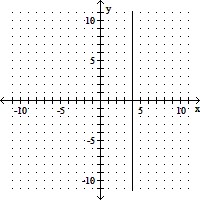
B. 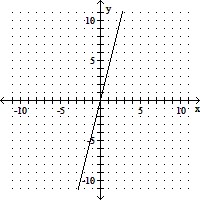
C. 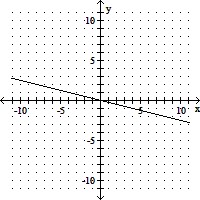
D.