You would use either a ______ to illustrate the data in this frequency distribution table.
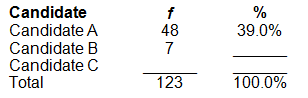
a. pie graph or frequency polygon
b. bar chart or pie graph
c. histogram or frequency polygon
d. bar chart or histogram
b. bar chart or pie graph
You might also like to view...
Movement education does not emphasize "correct answers." Which of the following facets of movement education relates to the promotion of creativity?
a. problem solving b. all of these choices c. divergent thinking d. self-expression
Schools that focus on developing the confidence, academic achievement, and leadership skills of young women or men by using their unique learning styles and cultural experiences are
a. Single-sex schools. b. Nonsexist schools. c. Homogenous schools. d. Biracial schools.
In a regression-discontinuity design the most likely validity threat is the:
a. random assignment b. history effect c. differential history effect d. differential attrition
What is the median for the set of data? 5, 7, 8, 10, 15, 22
a. 3.50 b. 6.00 c. 9.00 d. 17.00