Solve the problem.The graph below shows the total sales of houses in a town from 2000 to 2005. The graph also shows the sale of houses in the summer , S, and in the other times of the year, Y.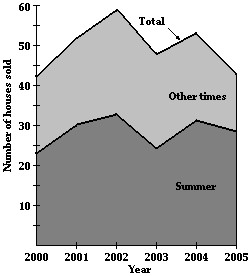 Estimate The number of houses sold in the summer of 2000.
A. 21
B. 24
C. 44
D. 29
Answer: B
Mathematics
You might also like to view...
Find the value.Let f(x, y) = xy2 +  . Find f(16, -3).
A. -771 B. (16, -3) is not in the domain of f. C. 148 D. -32
Mathematics
Give an appropriate answer.Let f(x) = 64. Find
 .
.
A. 64 B. 2.8284 C. 8 D. 10
Mathematics
Provide an appropriate response.If a ? b, is it always true that -8a ? -8b? Explain.
What will be an ideal response?
Mathematics
Identify the figure as a line, a ray, a line segment, or an angle. Then name the figure using the given points.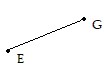
A. line segment; 
B. line; 
C. angle; ?GE
D. ray; 
Mathematics