Graph the given line.y = -3
A. 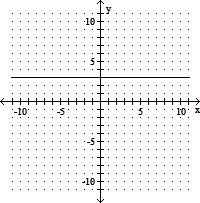
B. 
C. 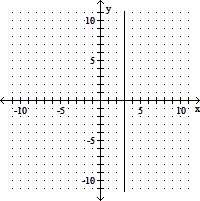
D. 
Answer: D
You might also like to view...
Create a graphical display for the data given. You may choose any graphic type that you feel is appropriate. Write a few sentences explaining why you chose this type of display and a few sentences describing any interesting patterns in the data.The table below gives information about U.S. families with children under the age of 18. The table shows the percentage of these families that are two-parent families, the percentage that are maintained by a single mother, and the percentage that are maintained by a single father. U.S. Families with Children Under 18 ?
?
What will be an ideal response?
Sketch the graph of the rational function. Note that the function is not in lowest terms.f(x) = 

A. x ? -4, 0
B. x ? 4, 0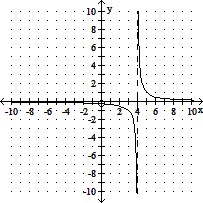
C. x ? 4, 0
D. x ? -4, 0
Perform the indicated operations and simplify the result. Leave the answer in factored form.
A. x + 2
B. 
C. 
D. x - 2
Verify the identity.sin4t = 2 sin2t cos2t
What will be an ideal response?