Solve the problem.The table below shows the population of a city in various years. Use the data to draw a graph of the population as a function of time. Use the graph to estimate when the population reached 6.4 million 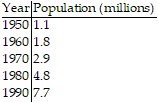
A. 1985
B. 1984
C. 1987
D. 1986
Answer: D
Mathematics
You might also like to view...
Answer the given question.Where are all points whose x-coordinates are -5?
A. On a line parallel to the x-axis, 5 units below. B. On a line parallel to the y-axis, 5 units to the left. C. On a line parallel to the x-axis, 5 units above. D. On a line parallel to the y-axis, 5 units to the right.
Mathematics
Factor completely.9y4 - 4
A. (3y2 + 2)2 B. (3y2 - 2)2 C. (3y2 + 2)(3y2 - 2) D. (9y2 + 1)(y2 - 4)
Mathematics
Use an equation to solve the percent problem.150% of 14 is what number?
A. 2.1 B. 21 C. 2100 D. 210
Mathematics
Solve the inequality symbolically. Express the solution set in interval notation.-8 ? -3 - 6x ? 8
A. [ , -
, -  ]
]
B. (-  ,
,  )
)
C. [-  ,
,  ]
]
D. ( , -
, -  )
)
Mathematics