Of the collection of supply and demand diagrams in Figure 2.2, which one shows the result of an increase in the taste for a good?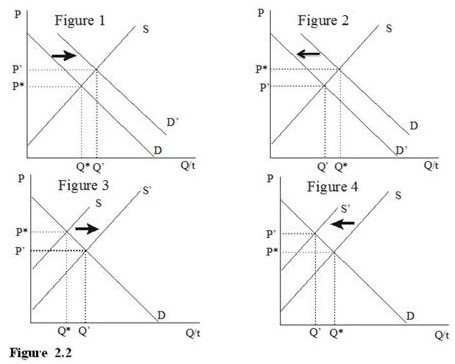
A. Figure 1
B. Figure 2
C. Figure 3
D. Figure 4
Answer: A
You might also like to view...
Suppose the demand curve is perfectly inelastic and the supply curve is upward sloping. The price sellers receive after a specific tax is imposed on sellers
A) is less than before the tax. B) is higher than before the tax. C) is unchanged. D) depends on the supply elasticity.
Suppose the economy was in equilibrium, and the national government increased spending by $200 billion. Monetarist theory would predict that:
a. Both consumption and investment will fall, and net exports will rise. b. Consumption will fall, and both investment and net exports will rise. c. Any increase in government spending will be offset dollar for dollar by reduction in private demand. d. In the end, government spending, consumption, investment, and net exports will all settle back to their old position with no net change in any of them.
The price elasticity for beef is -0.5. If price for beef in the market increases (by a small amount), beef producers can expect their total value of sales (total revenue) to:
a. increase b. decrease c. stay the same d. can't tell from the available information
The M1 definition of money includes ______.
a. savings deposits b. stocks c. traveler’s checks d. time deposits