Determine whether the basic feasible solution corresponding to the given tableau is optimal. x1 x2 x3 x4 M
A. Optimal
B. Not optimal
Answer: A
You might also like to view...
The following table shows the average rice yield Y, in tons per hectare, on Asian farms t years after 1980. Explain in practical terms the meaning of the slope of the regression equation. t 5 10 20 25Y 3.35 3.66 3.95 4.14? ?
A. Each year yield decreases by an average of 0.04 tons per hectare. B. Each year yield increases by an average of 0.04 tons per hectare. C. Each year yield increases by an average of 0.52 tons per hectare. D. Each year yield decreases by an average of 0.52 tons per hectare.
Solve the equation.ex - 5 =  x + 4
x + 4
A. 
B. 
C. 
D. 
Use the data to complete the table.The following is the number of bonus points that 24 students have received for extra work. 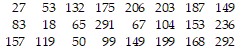

A. Frequency: 2, 6, 4, 7, 3, 2 B. Frequency: 2, 5, 6, 6, 3, 2 C. Frequency: 2, 6, 5, 5, 4, 2 D. Frequency: 2, 6, 5, 6, 3, 2
Solve the problem.The ocean surface is at 0 ft elevation. A diver is underwater at an elevation of -190 ft near a rock formation. In this area, the ocean floor has an elevation of -282 ft. The rock formation rises to a peak 133 ft above the ocean floor. How many feet below the top of the rock formation is the diver?
A. 57 ft B. 149 ft C. 92 ft D. 41 ft