Plot and interpret the appropriate scatter diagram.The one-day temperatures for 12 world cities along with their latitudes are shown in the table below. Make a scatter diagram for the data. Describe what happens to the one-day temperatures as the latitude increases.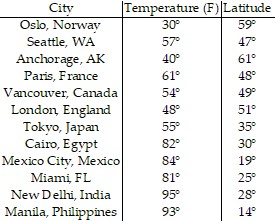 Latitude (degrees)
 Temperature (F)°
What will be an ideal response?
Latitude (degrees)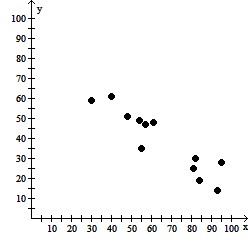
Temperature (F)°
As the latitude increases, the one-day temperatures decrease.
Mathematics
You might also like to view...
Use l'Hopital's Rule to evaluate the limit.

A. -5 B. 0 C. 5 D. 1
Mathematics
Find an equation for the sphere with the given center and radius.Center (-5, 4, 0), radius = 10
A. x2 + y2 + z2 - 10x - 8y = 59 B. x2 + y2 + z2 + 10x - 8y = 59 C. x2 + y2 + z2 - 10x + 8y = 59 D. x2 + y2 + z2 + 10x + 8y = 59
Mathematics
Solve the equation.10r2 = 2r
A. {0}
B. 
C. 
D. {0, 5}
Mathematics
Solve the problem.If the average person in Country X consumes 360 lb of poultry annually, express the total annual poultry consumption of Country X, P, as a function of the size of the population, n.
A. P = 360n B. P = n - 360 C. P = 360 D. n = 360P
Mathematics