The equation  is the
A. average propensity to consume.
B. average propensity to save.
C. marginal propensity to consume.
D. marginal propensity to save.
Answer: A
You might also like to view...
Use the following graphs to answer the next question.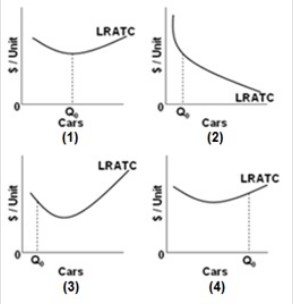 For which graph are there economies of scale throughout the entire range of output of cars?
A. Graph 1 B. Graph 2 C. Graph 3 D. Graph 4
A British inventor sells a patent to a U.S. corporation for $25,000. If the U.S. financial account remains unchanged, ________.
A. the U.S. price level will fall and the unemployment rate will rise B. the U.S. price level will rise and the unemployment rate will fall C. both the U.S. price level and unemployment rate will rise D. both the U.S. price level and unemployment rate will fall
The figure above shows the relationship between the time a student spends studying and the student's GPA that semester. This figure shows ________ relationship between the time spent studying and the GPA
A) a positive, linear B) a positive but not linear C) a cross-sectionally trended D) a negative E) no
Private firms and public bureaus differ in the sense that public bureaus
a. sometimes have top-level managers chosen by shareholders b. sell most of their output on a per unit basis c. receive most of their revenues through a budget appropriation rather than through the sales of goods or services d. are sometimes inefficient e. hire consultants to solve difficult problems