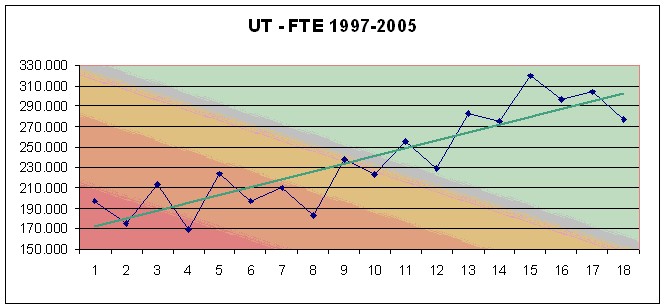
 This graph is a __________ graph.
A. histogram
B. line
C. bar
D. frequency polygon
Answer: B
You might also like to view...
Find the production matrix for the input-output and demand matrices.A =  , D =
, D = 
A. 
B. 
C. 
D. 
Solve the system of equations using substitution.
A. (-3, 0) B. (-3, -3) C. (3, -3) D. (-3, 3)
Determine the vertical asymptote(s) of the given function. If none exists, state that fact. f(x) = 
A. x = -2, x = 2 B. x = 0, x = -2 C. x = 0, x = 2 D. x = 0, x = -2, x = 2
The following double-bar graph illustrates the revenue for a company for the four quarters of the year for two different years. Use the graph to answer the question. 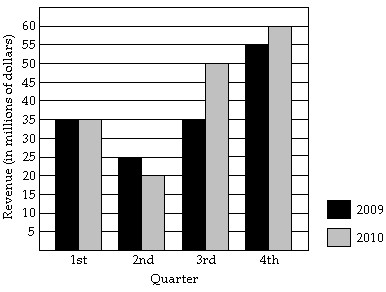 Which quarter for 2010 had the greatest increase in revenue compared to the same quarter for 2009?
A. third quarter B. fourth quarter C. first quarter D. second quarter