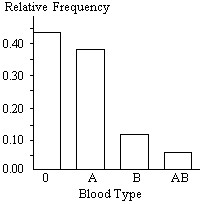
Make a bar graph to represent the data.Construct a vertical bar graph for the relative frequencies given.
What will be an ideal response?
You might also like to view...
Determine whether the two given lines are perpendicular.y = -4xx = 9
A. Yes B. No
Provide a response as requested.The city council gave a questionnaire to its citizens, asking them to rank their priorities for next year's budget. People were asked to rank the following four choices: (P)olice, (R)oads, (S)chools, and (T)rash removal. The results are summarized in the table below.Number of Ballots State who the Borda count winner is. Explain whether this satisfies the majority, Condorcet, and independence-of-irrelevant-alternatives criteria.
What will be an ideal response?
Translate to a proportion and solve. 100% of what is 10?
A. 20 B. 100 C. 1 D. 10
Give the coordinates of the point described on the unit circle.The reflection of the point  across the x-axis
A. 
B. 
C. 
D. 