Based on the figure below. Starting from long-run equilibrium at point C, a tax increase that decreases aggregate demand from AD1 to AD will lead to a short-run equilibrium at point ________ and eventually to a long-run equilibrium at point ________, if left to self-correcting tendencies.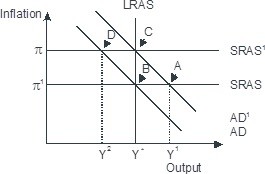
A. D; C
B. D; B
C. A; B
D. B; C
Answer: B
You might also like to view...
A firm has $200 million in total revenue and explicit costs of $190 million. Suppose its owners have invested $100 million in the company at an opportunity cost of 10 percent interest rate per year. The firm's economic profit is:
a. $400 million. b. $100 million. c. $80 million. d. zero.
Refer to Figure 8.1. Which graph best represents a variable cost function?
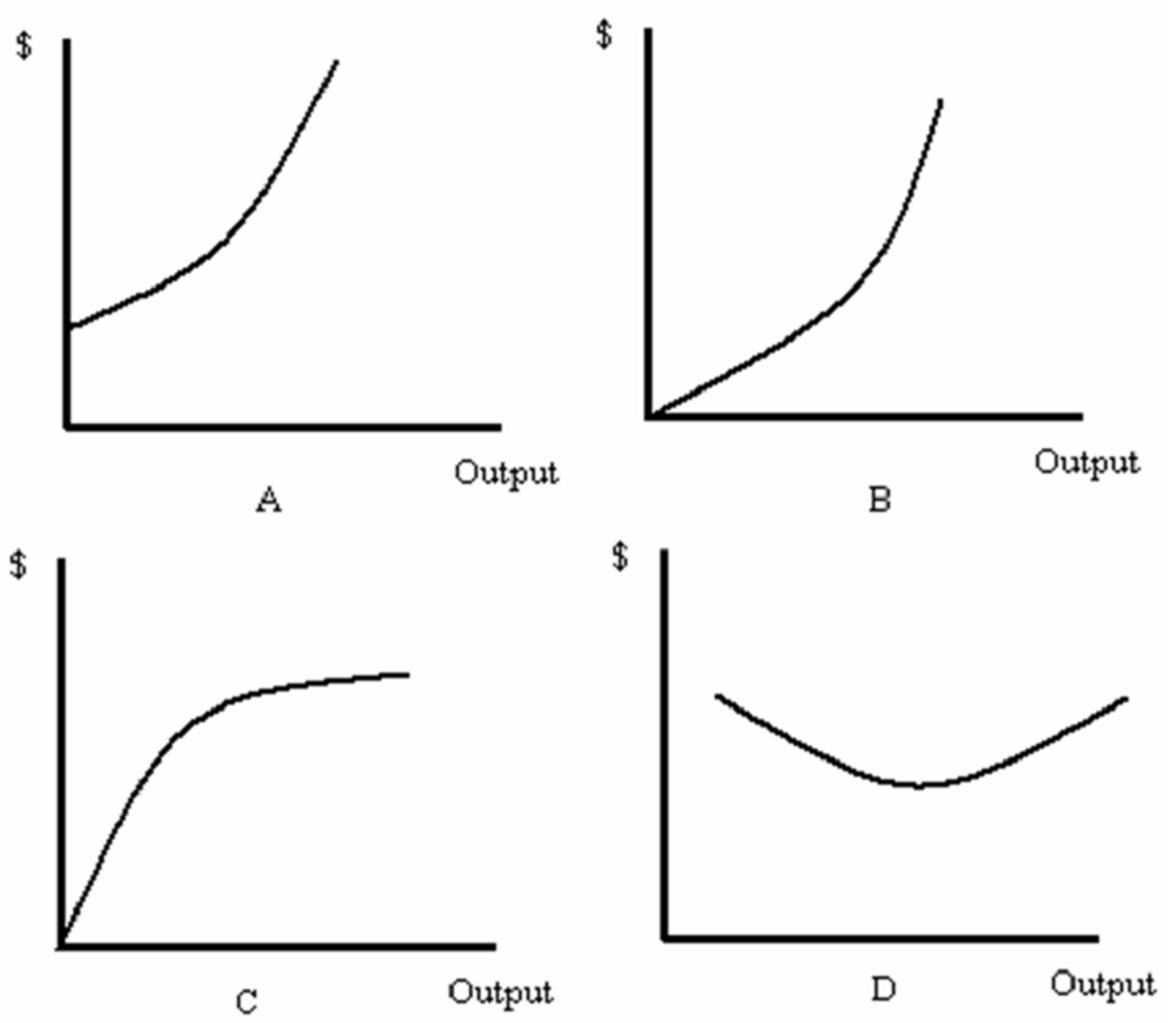
A. A
B. B
C. C
D. D
A. households are on the buying side of both product and resource markets. B. businesses are on the selling side of both product and resource markets. C. households are on the selling side of the resource market and on the buying side of the
product market. D. businesses are on the buying side of the product market and on the selling side of the resource market. A. capital goods and consumer goods. B. free and controlled. C. product and resource. D. household and business.
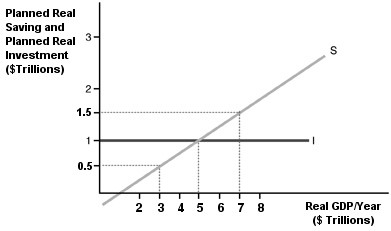 In the above diagram, what happens if the real GDP is $3 trillion? $5 trillion? $7 trillion? What is the equilibrium level of real GDP? Why?
What will be an ideal response?