Use a graphing utility to (a) plot the graphs of the given functions and (b) find the approximate x-coordinates of the points of intersection of the graphs. Then find an approximation of the volume of the solid obtained by revolving the region bounded by the graphs of the functions about the x-axis. Round answers to two decimal places.

a. 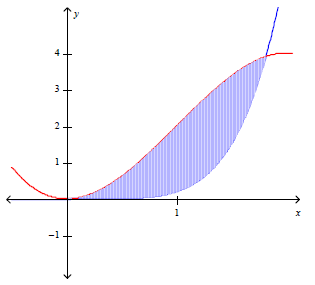
b. (0, 0) and (1.81, 3.90), 20.15
Mathematics
You might also like to view...
Write as a percent.
A. 1 %
%
B. 72 %
%
C. 14 %
%
D. 145 %
%
Mathematics
Provide an appropriate response.A point is 1 percent of the amount of the loan.
A. True B. False
Mathematics
The graph of the function f (x) is a translation of the graph of ![]() . Graph the function.
?
. Graph the function.
?
![]() ?
?
A. ?
![]()
B. ?
![]()
C. ?
![]()
D. ?
![]()
Mathematics
Solve the system graphically.x + y = -95x - y = -45
A. (0, -9) B. (-9, 0) C. (-9, 5) D. (0, 5)
Mathematics