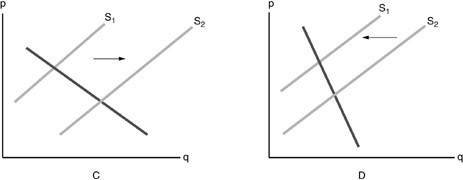
 Refer to the above figure. Plastic is an input for producing cellphones. Which diagram shows the effect on the supply of cellphones when the price of plastic has increased?
A. graph C
B. graph D
C. neither graph
D. both graphs
Answer: B
You might also like to view...
How is the demand for labor derived from the value of marginal product of labor?
What will be an ideal response?
Which of the following is NOT a characteristic or focus of microeconomics?
A) individual consumers. B) analysis of aggregate economic variables C) firm behavior D) individual markets
Which of the following is least accurate about the US during World War I?
a. The armed forces increased from about 180,000 to 3 million. b. Soldiers were obtained through volunteer army and without a draft. c. Many new agencies were started to regulate prices. d. The US was a formal participant in the war for only 19 months.
The nominal gross domestic product (GDP) for a country was $1,000 in 2003 and $1,500 in 2004 . The GDP price index was 100 in 2003 and 150 in 2004 . Between 2003 and 2004, real GDP _____
a. increased by $500 b. increased by $333 c. increased by $50 d. remained the same e. decreased by $50