Determine whether the scatter diagram indicates that a linear relation may exist between the two variables. If a linear relation does exist, indicate whether the slope is positive or negative.Draw a scatter diagram of the given data. Find the equation of the line containing the points  and
and  Graph the line on the scatter diagram.
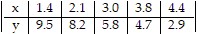
A. 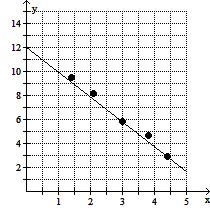
y = -2.07x + 12.01
B. 
y = 2.3x + 13.04
C. 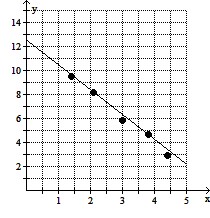
y = -2.53x + 13.54
D. 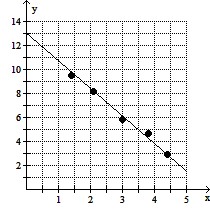
y = -2.3x + 13.04
Answer: D
Mathematics
You might also like to view...
Find y '.y = (3x3 + 7)(3x7 - 8)
A. 90x9 + 147x6 - 72x2 B. 90x9 + 147x6 - 72x C. 12x9 + 147x6 - 72x2 D. 12x9 + 147x6 - 72x
Mathematics
Graph the inverse of the function plotted, on the same set of axes. Use a dashed curve for the inverse.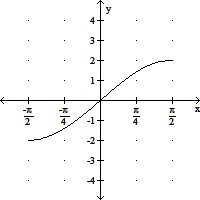
A. 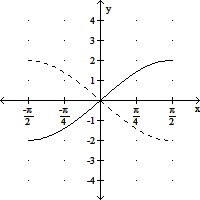
B. 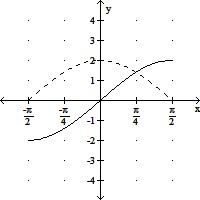
C. 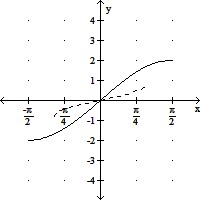
D. 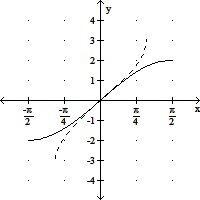
Mathematics
Solve the problem.The length of a rectangle is 8 inches more than its width. If 4 inches are taken from the length and added to the width, the figure becomes a square with an area of 196 square inches. What are the dimensions of the original figure?
A. 10 in. by 18 in. B. 10 in. by 14 in. C. 14 in. by 14 in. D. 6 in. by 14 in.
Mathematics
Add.87536
A. 1,545 B. 1,739 C. 1,415 D. 1,315
Mathematics