Using Figure 1 above, if the aggregate demand curve shifts from AD3 to AD2 the result in the long run would be: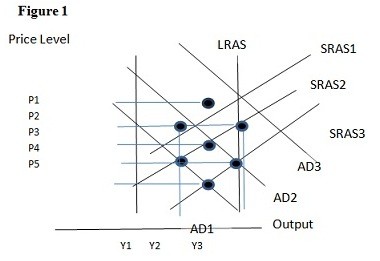
A. P1 and Y2.
B. P2 and Y1.
C. P3 and Y1.
D. P3 and Y2.
Answer: D
You might also like to view...
The table above presents the production possibilities frontier for a nation. Using the information in the table, moving from possibility C to B means that
A) 4 units of capital goods are given up to get 55 units of consumption goods. B) 2 units of capital goods are given up to get 55 additional units of consumption goods. C) 4 units of capital goods are given up to get 10 additional units of consumption goods. D) 4 units of capital goods are given up to get 45 units of consumption goods. E) 2 units of capital goods are given up to get 10 additional units of consumption goods.
Marginal revenue, graphically, is
A) the slope of a line from the origin to a point on the total revenue curve. B) the slope of a line from the origin to the end of the total revenue curve. C) the slope of the total revenue curve at a given point. D) the vertical intercept of a line tangent to the total revenue curve at a given point. E) the horizontal intercept of a line tangent to the total revenue curve at a given point.
The internal rate of return is likely to lead to incorrect decisions.
A. True B. False C. Uncertain
A high-risk premium makes default more likely.
Answer the following statement true (T) or false (F)