The graph of the derivative  (x) of a continuous function f is shown. On what intervals is f decreasing?

(1, 3) ? (4, 6)
Mathematics
You might also like to view...
In the circuit below, E = 20 V and VR = 9 V. Find VC and é.
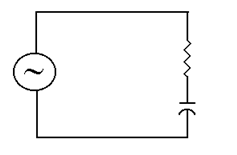
a. é = -24.2ø, VC = 17.9 V
b. é = -26.4ø, VC = 44.5 V
c. é = -24.2ø, VC = 17.9 V
d. é = -63.3ø, VC = 17.9 V
e. é = -63.3ø, VC = 44.5 V
Mathematics
Write an inequality involving the variable x that describes the set of numbers graphed.![]()
A. x > -2 B. x ? -2 C. x < -2 D. x ? -2
Mathematics
Suppose 100 people counted the number of cars passing an intersection in one hour. Due to error, not all people get the same value. The mean is 75 and the standard deviation is 1. Use the sketch to find how many people report the following.  Between 77 and 78 cars
A. 3 people B. 98 people C. 15 people D. 2 people
Mathematics
Add.
A. 17,624 B. 16,524 C. 17,514 D. 16,614
Mathematics