The production possibilities curve depicts the combinations of two goods that can be
a. viewed as creating international specialization, one country producing one good, the other a second good
b. produced with a given level of technology and set of resources
c. consumed with a given quantity of resources and level of technology
d. produced with varying levels of unemployment of resources
e. produced with varying levels of unemployment and underemployment of resources
B
You might also like to view...
Countries where investment is
A) relatively unproductive should have current account deficits. B) relatively productive should have current account surpluses. C) relatively productive should have current account deficits. D) relatively productive should have balanced current accounts. E) relatively unproductive should have balanced current accounts.
A corn farmer is likely to have a _____________ price elasticity of supply than does a tree farmer due to ________________.
A. more elastic; a more flexible production process B. less elastic; a more flexible production process C. less elastic; a less flexible production process D. more elastic; a less flexible production process
Who generally bears most of a sales tax when the demand for the good taxes is inelastic?
What will be an ideal response?
Using Figure 1 above, if the aggregate demand curve shifts from AD2 to AD1 the result in the long run would be: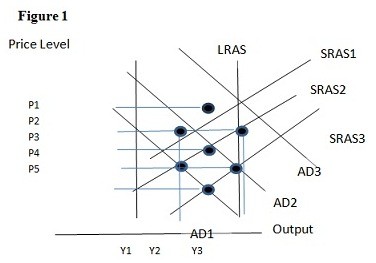
A. P4 and Y1. B. P4 and Y2. C. P5 and Y1. D. P5 and Y2.