Solve the problem.The following graph shows the private, public and total national school enrollment for students for select years from 1970 through 2000.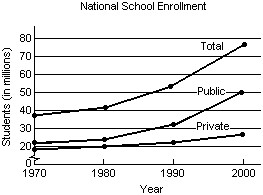 i) How is the graph for total school enrollment, T, determined from the graph of the private enrollment, r, and the public enrollment, u?ii) During which 10-year period did the total number of students enrolled increase the least?iii) During which 10-year period did the total number of students enrolled increase the most?
A.
| i) | T is the sum of r and u. |
iii) 1970-1980
B.
| i) | T is the sum of r and u. |
iii) 1980-1990
C.
| i) | T is the difference of r and u. |
iii) 1990-2000
D.
| i) | T is the sum of r and u. |
iii) 1990-2000
Answer: D
Mathematics
You might also like to view...
Decide whether the given set of numbers is a group under the given operation.Integers; addition
A. Yes B. No
Mathematics
-17 < -5a + 3 ? 3![]()
A. (0, 4]![]()
B. (-4, 0]![]()
C. [-4, 0)![]()
D. [0, 4)![]()
Mathematics
Graph the function as a solid line or curve and its inverse as a dashed line or curve on the same axes.f(x) = 2x + 6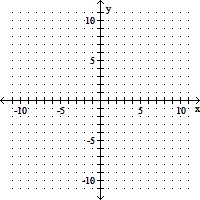
A. 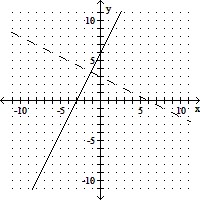
B. 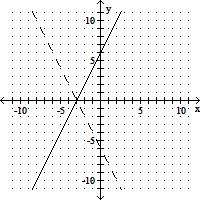
C. 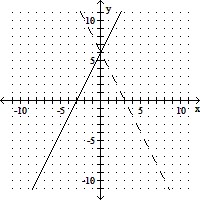
D. 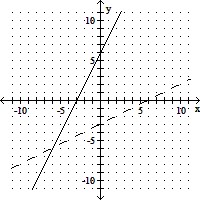
Mathematics
Determine the absolute value function f(x) that has been graphed.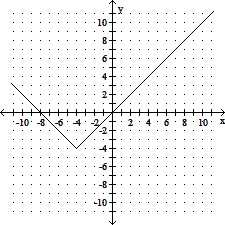
A. f(x) =  + 4
+ 4
B. f(x) =  - 4
- 4
C. f(x) =  + 4
+ 4
D. f(x) =  - 4
- 4
Mathematics