The graph below shows estimated world population for the period 4000 BC - 2000 AD. Note that the logarithm of the world population and not actual population is plotted on the vertical axis. This means, for example, that when the graph reaches 7 on the vertical scale, world population is 107 and when the graph reaches 9 on the vertical scale, world population is 109. Log World Population 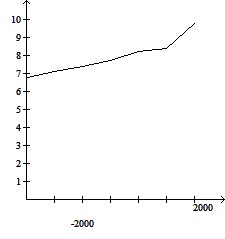 ? Year Use the graph to answer the question.During the period 4000 BC to 1000 BC, approximately what was the doubling time for world population?
A. Approximately 3000 years
B. Approximately 1000 years
C. Approximately 5000 years
D. Approximately 23,000 years
Answer: B
You might also like to view...
If we have a function giving the weight of a man in terms of his height and a function giving the height of this man in terms of his age, we can compose the two functions to get the man's weight in terms of his age.
Answer the following statement true (T) or false (F)
Determine whether or not the triangles are similar.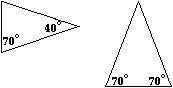
A. Not similar B. Similar
Solve the problem. Use a FICA rate of 6.2%, a Medicare rate of 1.45%, and an SDI rate of 1%. Assume the person's earnings will not exceed $31,800 for the year. Round to the nearest cent if needed.Donald Ruffano is paid a salary of $419 per week plus a commission of 3% on sales. During a recent week, he had sales of $9846.23. Find his Social Security tax, Medicare tax, and SDI deduction for the week.
A. $17.53, $2.95, $2.83 B. $44.29, $10.36, $7.14 C. $18.31, $4.28, $2.95 D. $25.98, $6.08, $4.19
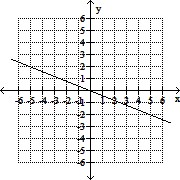
Graph the line whose equation is given.y = -  x - 1
x - 1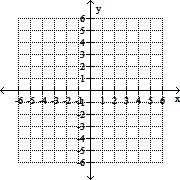
A. 
B. 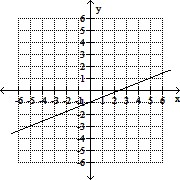
C. 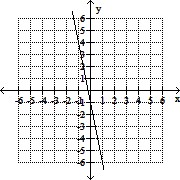
D.