Solve the problem.Suppose that the speed of a car, measured in miles per hour (mph), is monitored for some short period of time after the driver applies the brakes. The following table and graph relate the speed of the car to the amount of time, measured in seconds (sec), elapsed from the moment that the brakes are applied.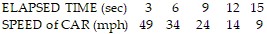
 What general trend do the data reflect? In which of the time intervals does the speed change the most?
A. With increasing elapsed time, the speed decreases. The speed changes most during the time interval from 3 seconds to 6 seconds.
B. With increasing elapsed time, the speed increases. The speed changes most during the time interval from 3 seconds to 6 seconds.
C. With increasing elapsed time, the speed increases. The speed changes most during the time interval from 12 seconds to 15 seconds.
D. With increasing elapsed time, the speed decreases. The speed changes most during the time interval from 12 seconds to 15 seconds.
Answer: A
You might also like to view...
Use an Euler diagram to determine whether the argument is valid or invalid.All horses whinny. Therefore, all brown horses whinny.
A. valid B. invalid
Use implicit differentiation to find the specified derivative at the given point.Find  at the point (1, 4, e2) for ln(xz)y + 5y3 = 0.
A. - 
B. 
C. 
D. - 
Perform the division.(35m9n - 30m8n5 + 20m7n7) ÷ (5m6n)
A. 7m15 - 6m14n6 + 4m13n8 B. 29 C. 7m3 - 6m2n4 + 4mn6 D. 7m3 - 30m8n5 + 20m7n7
Solve.If y varies directly as x, and y = 3 when x = 4, find y when x = 16.
A. 
B. 
C. 12
D. 