Use the given table or graph to write the inequality described.The wages of the employees of a company are presented in this graph. 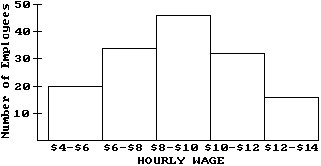 Use an inequality to compare the number of employees who make $4-$6 and those who make $8-$10.
A. 20 < 34
B. 30 > 20
C. 25 < 40
D. 20 < 45
Answer: D
You might also like to view...
A pair of honest dice is rolled, and the number on each die is noted.What is the probability of rolling a total of 7?
A. 
B. 
C. 
D. 
E. none of these
Solve the problem.A propeller on a wind generator rotates 1.24 rad in 1.5 s. How many degrees does the propeller rotate in 
A. 35.5° B. 0.022° C. 71.0° D. 142°
Provide an appropriate response.If p is a prime number, is  in simplified form? Explain.
What will be an ideal response?
An investor has $450,000 to invest in two types of investments. Type A pays 6% annually and type B pays 7% annually. To have a well-balanced portfolio, the investor imposes the following conditions. At least one-third of the total portfolio is to be allocated to type A investments and at least one-third of the portfolio is to be allocated to type B investments. What is the optimal amount that should be invested in each investment?
A. $160,000 in type A (6%), $290,000 in type B (7%) B. $0 in type A (6%), $450,000 in type B (7%) C. $450,000 in type A (6%), $0 in type B (7%) D. $300,000 in type A (6%), $150,000 in type B (7%) E. $150,000 in type A (6%), $300,000 in type B (7%)