Using Figure 1 above, if the aggregate demand curve shifts from AD1 to AD2 the result in the short run would be: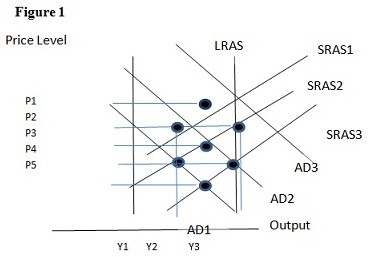
A. P1 and Y2.
B. P3 and Y1.
C. P2 and Y2.
D. P2 and Y3.
Answer: D
You might also like to view...
Employing the information in Figure 3-2 above, when real disposable income is 1000, savings from households would be ________ and the marginal propensity to save would be ________
A) 300; 0.1 B) 100; 0.2 C) 100; 0.1 D) 500; 0.2
A way to summarize the actions and payoffs of a sequential game is to use a:
A. payoff tree. B. decision matrix. C. flowchart. D. decision tree.
In the long run, a year-long drought that destroys most of the summer's wheat crops causes permanently:
A. higher prices. B. lower prices. C. lower output. D. None of these is true.
The data points on a supply curve come from
A. the same place from which we get the data points on a demand curve. B. the supply schedule. C. companies' annual reports. D. survey analysis.