Solve the problem.The following graph shows a weight and height chart. The weight w is listed in pounds and the height h in inches. The shaded area is a recommended region. 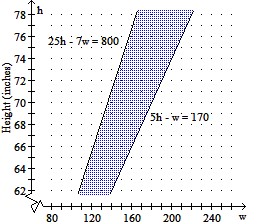 Weight (pounds)What does this chart indicate about an individual who weighs 140 pounds and is 73 inches tall?
A. This individual's weight falls within the recommended region for his or her height.
B. There is not enough information given.
C. This individual weighs more than recommended for his or her height.
D. This individual weighs less than recommended for his or her height.
Answer: D
Mathematics
You might also like to view...
Find the limit.
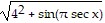
A. 0
B. 
C. 1
D. 4
Mathematics
Identify the type of sampling described by the proposal.A writer for an art magazine randomly selects and interviews fifty male and fifty female artists.
A. cluster sample B. stratified sample C. simple random sample D. systematic sample E. convenience sample
Mathematics
Find the median. If necessary, round to one decimal place.1, 3, 11, 26, 44, 45, 48
A. 26 B. 11 C. 25.9 D. 44
Mathematics
Graph the circle.x2 + y2 + 12x + 2y + 21 = 0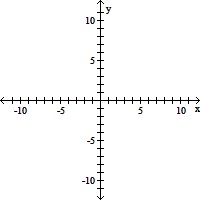
A. 
B. 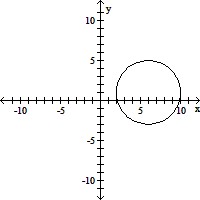
C. 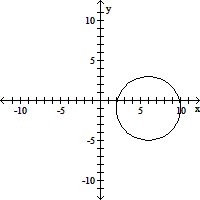
D. 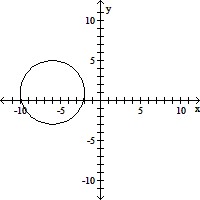
Mathematics