Based on the figure below. Starting from long-run equilibrium at point C, a tax increase that decreases aggregate demand from AD1 to AD will lead to a short-run equilibrium at point ________ and eventually to a long-run equilibrium at point ________, if left to self-correcting tendencies.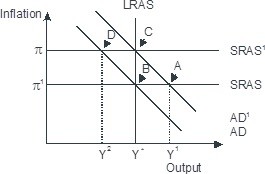
A. D; C
B. D; B
C. A; B
D. B; C
Answer: B
You might also like to view...
A researcher wants to test the effects of daily meditation on stress levels of individuals. She divides the participants randomly into a treatment group and into a control group and conducts an experiment
She pays for meditation classes for one-half of the subjects, and the other half does not join the class. Which of the following statements is true of the two groups in this experiment? A) The participants in the treatment group are assigned by chance, whereas the ones in the control group are assigned by choice. B) The participants in the control group are assigned by chance, whereas the participants in the treatment group are assigned by choice. C) The treatment group is the group of subjects that receives finance from the researcher for meditation classes; the control group is the group that does not. D) The control group is the group of subjects that receives finance from the researcher to join the meditation class; the treatment group is the group that does not.
Bill the butcher is upset because the government plans to tax beef $.10 a pound. "I hate paying taxes," he says. "Because of this, I'm raising all my beef prices by $.10 a pound. The consumers will bear this burden, not me." Do you see anything wrong with this way of thinking? Explain
According to liquidity preference theory, a decrease in money demand for some reason other than a change in the price level causes
a. the interest rate to fall, so aggregate demand shifts right. b. the interest rate to fall, so aggregate demand shifts left. c. the interest rate to rise, so aggregate demand shifts right. d. the interest rate to rise, so aggregate demand shifts left.
Economic growth, as measured by increases in per-capita real GDP, was at its strongest during the
A. 1970s. B. 1960s. C. 1980s. D. 1950s.