The line graph below shows the price of a stock over the course of the day. Use the graph to answer the question(s).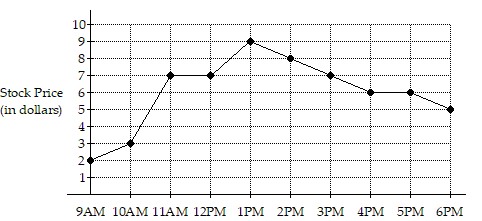 At what time was the stock price the lowest?
A. 6 PM
B. 1 PM
C. 9 AM
D. 10 AM
Answer: C
You might also like to view...
Provide an appropriate response. Perform the multiplication: x2(x2 + 3x - 4)
A. x4 + 3x3 - 4x2 B. x4 + 3x2 - 4 C. x4 + 3x3 - 4 D. x4 + 3x - 4x2
Provide an appropriate response.A shipment of 20 digital cameras contains two that are defective. A random sample of three is selected and tested. Let X be the random variable associated with the number of defective cameras in a sample. Find the probability distribution of X and the expected number of defective cameras in a sample.
What will be an ideal response?
Classify the angle as acute, right, obtuse, or straight.35°
A. straight B. right C. acute D. obtuse
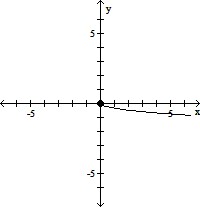
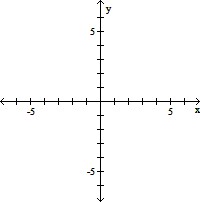
Graph the function by starting with the graph of the basic function and then using the techniques of shifting, compressing, stretching, and/or reflecting.f(x) = 

A. 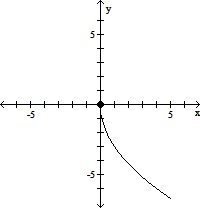
B. 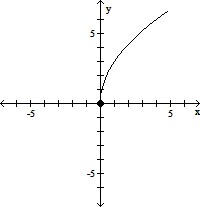
C. 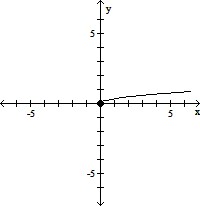
D.